My college football model ranks all 138 FBS teams after every week and picks every game before kickoff. Here's week 7: the top 25, the games worth your Saturday and the model's biggest arguments. Every team and every pick is on the live power rankings page, and here's how this is made.
Model update this week: Preseason ratings now fade as the season goes: they count for less from week 7 and not at all from week 10, so midseason rankings come from this season's games. Tested on 2022 through 2025, the change predicts as well as before (12.46 vs. 12.40 points of average miss, 71.4% vs. 71.2% of winners picked). Week 7 picks were re-locked with the updated model before any game kicked off; the original picks are kept in the data. Thanks to the r/CFB readers who asked why 3-2 Oregon sat above the UCLA team that beat it. All model changes.
Model update this week: A confirmed quarterback absence now moves a team's rating by half the gap between the starter and his replacement, measured with opponent-adjusted EPA, with little-used backups valued near replacement level. Tested on the 246 games in 2024 and 2025 where an established starter sat, that cut the average miss on those games from 12.29 to 12.06 points and helped in both seasons. Other injuries are noted on team pages and in posts but not priced: missing running backs and receivers showed no reliable effect. The rankings also show the betting market's ranking now, for comparison only. And a play-by-play fix: players whose names end in Jr. could have plays credited to a teammate with the same number (160 plays this season); unit ranks and player numbers now use the corrected data. All model changes.
Week 7 at a glance
- No. 1: Alabama (5-1), holding the top spot.
- Game of the week: No. 5 Ohio State at No. 6 Indiana. The model gives Ohio State a 52% chance.
- Texas is No. 7 and a 78% favorite against Florida.
- Biggest disagreement with the AP poll: LSU, No. 8 in the model and No. 22 in the AP.
Jump to: The top 25 · Game of the week · Forty Acres Report · LSU · Playoff picture · Other games
Week 7 power rankings: the top 25
Rank is the model's power rating: who would be favored on a neutral field next week, not who has the best résumé. Opponent ranks are the model's too. The AP poll and the betting market's ranking (from this season's point spreads) are there for comparison.
| Rank (prev.) | Team | Record | This week (win %) | AP poll | Vegas |
|---|---|---|---|---|---|
| 1 (1) | Alabama | 5-1 | at No. 17 Tennessee (77%) | 6 | 9 |
| 2 (2) | Notre Dame | 6-0 | at No. 14 BYU (71%) | 2 | 1 |
| 3 (4) | Georgia | 6-0 | vs. Auburn (89%) | 1 | 5 |
| 4 (5) | Miami | 5-0 | vs. Florida State (88%) | 3 | 4 |
| 5 (3) | Ohio State | 5-1 | at No. 6 Indiana (52%) | 4 | 2 |
| 6 (8) | Indiana | 6-0 | vs. No. 5 Ohio State (48%) | 5 | 3 |
| 7 (6) | Texas | 4-1 | vs. Florida (78%) | 7 | 7 |
| 8 (7) | LSU | 4-2 | vs. No. 19 Mississippi State (71%) | 22 | 10 |
| 9 (9) | Utah | 5-0 | at Colorado (85%) | 11 | 13 |
| 10 (18) | UCLA | 5-0 | vs. Wisconsin (71%) | 12 | 49 |
| 11 (11) | Texas Tech | 5-0 | vs. Arizona State (91%) | 10 | 8 |
| 12 (13) | Missouri | 5-1 | at No. 18 Ole Miss (52%) | 13 | 27 |
| 13 (16) | Nebraska | 5-1 | at No. 16 Oregon (45%) | NR | 15 |
| 14 (14) | BYU | 5-0 | vs. No. 2 Notre Dame (29%) | 8 | 19 |
| 15 (26) | Houston | 5-1 | vs. Oklahoma State (75%) | 20 | 29 |
| 16 (10) | Oregon | 3-2 | vs. No. 13 Nebraska (55%) | NR | 6 |
| 17 (12) | Tennessee | 5-1 | vs. No. 1 Alabama (23%) | 14 | 23 |
| 18 (20) | Ole Miss | 4-1 | vs. No. 12 Missouri (48%) | 9 | 12 |
| 19 (21) | Mississippi State | 4-1 | at No. 8 LSU (29%) | 16 | 59 |
| 20 (27) | Arizona | 5-1 | Bye | NR | 28 |
| 21 (23) | Northwestern | 4-1 | at Michigan State (71%) | 25 | 35 |
| 22 (38) | Wake Forest | 5-1 | at California (75%) | 21 | 31 |
| 23 (22) | Boise State | 5-1 | Bye | 23 | 26 |
| 24 (17) | USC | 6-1 | Bye | 19 | 11 |
| 25 (25) | James Madison | 6-0 | vs. Georgia State (74%) | NR | 48 |
- Injury adjustment: UCLA: starting quarterback Nico Iamaleava is out for the season with a knee injury from the Oregon game, and Ty Dieffenbach, who took over in that game's second half, is expected to start. The model's UCLA rating is built on games Iamaleava started (ESPN). The model takes 0.2 points off UCLA's rating for it, half the gap between the two quarterbacks' numbers, the share that best predicted results when starters missed games in 2024 and 2025. It's a small change because Nico Iamaleava's passing numbers this season were close to the backup level the model assumes for Ty Dieffenbach.
Where the betting market disagrees most: the model is 12 points higher on UCLA (No. 10 here, No. 49 in Vegas); the model is 10 points higher on Alabama (No. 1 here, No. 9 in Vegas); the model is 9 points higher on Mississippi State (No. 19 here, No. 59 in Vegas). When the model and the Vegas line have disagreed by 6 or more points on a game, the line has been closer to the final margin 62% of the time, so treat these as the model's boldest calls.
Alabama and No. 2 Notre Dame are 1.8 points apart, effectively a tie. Ratings, projections and playoff odds for every team are on the live page.
Head-to-head check: the model rates whole seasons, so a team can sit above one that beat it.
- Alabama (No. 1) over Georgia (No. 3): Georgia won 20-17 on the road in week 6. A 3-point game is a single result, and over the whole season the model rates Alabama 4.2 points better. Its rushing offense ranks No. 3 of 138.
- Ohio State (No. 5) over Texas (No. 7): Texas won 24-23 at home in week 2. A 1-point game is a single result, and over the whole season the model rates Ohio State 4.2 points better. Its pass defense ranks No. 2 of 138.
- LSU (No. 8) over Ole Miss (No. 18): Ole Miss won 32-24 at home in week 3. An 8-point game is a single result, and over the whole season the model rates LSU 5.7 points better. Its pass defense ranks No. 3 of 138.
Game of the week: Ohio State at Indiana pick and preview
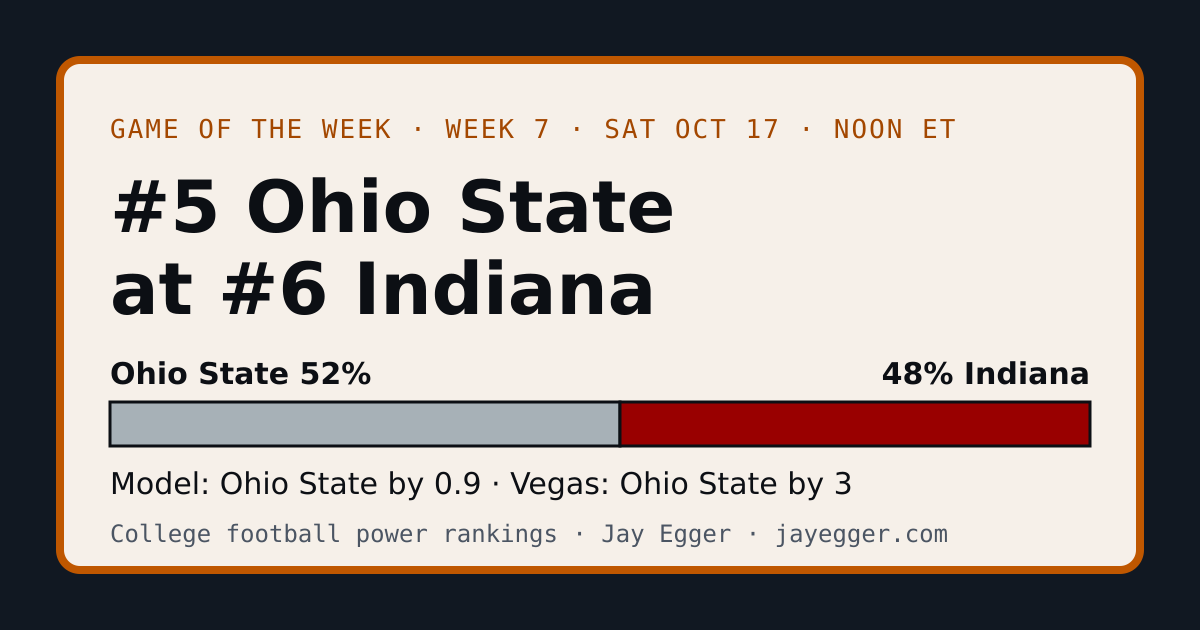
The pick: Ohio State by 0.9 (52%). Vegas has Ohio State by 3. Saturday at noon ET on Fox.
What's at stake: With a win, Ohio State's playoff odds go to 91%; with a loss, they drop to 68%. With a win, Indiana's playoff odds go to 90%; with a loss, they drop to 68%.
The series: Ohio State leads the all-time series 81-13-5. Last meeting: Indiana won 13-10 in a conference title game in 2025.
How each team wins
Unit ranks are out of 138 FBS teams.
- Ohio State: win the strength-on-strength fight, its pass defense (No. 2) against Indiana's passing offense (No. 2).
- Indiana: lean on its biggest edge, its run defense (No. 5) against Ohio State's rushing offense (No. 63).
Based on how it has played, Ohio State would usually be about 6-0, so its 5-1 record undersells its play. Based on how it has played, Indiana would usually be about 6-0, and that's what its record says.
Players to watch
- Ohio State
- QB Julian Sayin: 1,772 yards, 17 TD, 2 INT (efficiency: No. 11 of 117 FBS quarterbacks)
- Top rusher Bo Jackson: 460 yards, 4 TD
- Top receiver Jeremiah Smith: 48 catches, 916 yards, 11 TD
- Pass rusher Kenyatta Jackson: 3 sacks, 4 tackles for loss
- Indiana
- QB Josh Hoover: 1,364 yards, 17 TD, 0 INT (efficiency: No. 2 of 117 FBS quarterbacks)
- Top rusher Turbo Richard: 597 yards, 5 TD
- Top receiver Charlie Becker: 30 catches, 529 yards, 8 TD
- Pass rusher Tobi Osunsanmi: 5 sacks, 9.5 tackles for loss
Forty Acres Report: Texas vs. Florida pick and preview
Full disclosure: I'm a Texas fan, so this section shows up every week. The model doesn't care.
The pick: Texas by 12.2 (78%). Vegas has Texas by 11.5. Saturday at noon ET (11 a.m. in Austin) on ABC, the same window as Ohio State at Indiana.
What's at stake: With a win, Texas's playoff odds go to 76%; with a loss, they drop to 43%.
The series: Texas leads the all-time series 3-1-1. Last meeting: Florida won 29-21 at Florida in 2025. Texas gets a shot at payback.
Where Texas stands
Texas is No. 7 in the model, down from No. 6, and No. 7 in the AP poll. Its path this season: 7, 10, 7, 7, 6, 7 (rankings before week 7 were rebuilt after launch). It spent 4 weeks at No. 1 in the AP poll; the model's best ranking for Texas has been No. 6.
Based on how it has played, Texas would usually be about 3-2, so its 4-1 record is a little better than its play. Playoff odds: 69% to make the 12-team field, 5% to win the SEC, 4% to win it all (more on the Texas page).
The Arch Manning question
Arch Manning came back to Texas for 2026 as a preseason Heisman co-favorite and one of the top two quarterbacks in most early 2027 NFL mock drafts (Heisman odds, mock drafts). So far the numbers haven't matched the billing: Manning is in the middle third of FBS quarterbacks in efficiency, adjusted for opponents (No. 40 of 117), with 10 touchdowns and 5 interceptions. His line hasn't made it easier: Texas allows a sack on 7.6% of dropbacks, No. 107 of 138 in FBS (sacks reflect the quarterback too). His Oklahoma game graded out above average once the defense is accounted for.
How each team wins
- Texas: lean on its biggest edge, its passing offense (No. 45) against Florida's pass defense (No. 84). Another advantage: its run defense (No. 13) against Florida's rushing offense (No. 32).
- Florida: it has no clear edge on paper, so its best shot is its run defense (No. 79) against Texas's rushing offense (No. 84).
Last week: the 27-24 loss to Oklahoma in the Red River Rivalry
Expected points added (EPA) measures how much each play changed a team's chances of scoring; "adjusted" accounts for the defense it came against.
- Arch Manning (19/31 for 260 yards, 3 TD, 2 INT): Better than the box score looks. Against the No. 15 pass defense, it was an above-average game for a quarterback. The two interceptions in a 3-point game still hurt. Expected points per dropback: 0.04 raw, 0.31 adjusted for the defense.
- Cam Coleman (5 catches for 110 yards, 1 TD)
- Derrek Cooper (8 carries for 41 yards): A below-average game for a runner against the No. 19 run defense. Expected points per carry: −0.06 raw, 0.02 adjusted for the defense.
- Colin Simmons (4 tackles, 3 for loss, 2 sacks): No FBS player had more sacks this week.
The season so far
| Opponent | Their defense | Texas offense, raw | Adjusted for the defense |
|---|---|---|---|
| Texas State | No. 80 | 0.31 | 0.29 |
| Ohio State | No. 10 | 0.07 | 0.26 |
| UTSA | No. 34 | 0.00 | 0.09 |
| Tennessee | No. 25 | 0.06 | 0.18 |
| Oklahoma | No. 11 | 0.03 | 0.21 |
Numbers are expected points added (EPA) per play. Even adjusted for the defenses, the offense has slipped. Over the last three games it averages 0.16 adjusted, against 0.28 before.
Up front: Texas allows a sack on 7.6% of dropbacks (No. 107 of 138; that's the line and the quarterback together) and gets stuffed at or behind the line on 14% of runs, adjusted for the defenses it has faced (No. 66).
Season leaders:
- Top rusher Daylan Smothers: 237 yards, 2 TD
- Top receiver Cam Coleman: 16 catches, 304 yards, 5 TD
- Pass rusher Colin Simmons: 9 sacks, 11.5 tackles for loss
Florida players to watch
- QB Aaron Philo: 1,341 yards, 9 TD, 3 INT (efficiency: No. 33 of 117 FBS quarterbacks)
- Top rusher Jadan Baugh: 672 yards, 12 TD
- Top receiver Dallas Wilson: 26 catches, 376 yards, 3 TD
- Pass rusher Jayden Woods: 4.5 sacks, 7 tackles for loss
LSU: the model's argument with the AP poll
LSU is No. 8 in the model but No. 22 in the AP poll. Here's the model's case:
- The defense: No. 1 of 138 in efficiency, adjusted for opponents (pass defense No. 3, run defense No. 8).
- The losses: 32-24 to Ole Miss on the road and 35-34 to Kentucky on the road, by a combined 9 points.
- The play: based on how it has played, LSU would usually be about 5-1, not 4-2 (postgame win probability, from CollegeFootballData).
- Why voters see it differently: they judge the record, and by résumé (wins above what a typical top-25 team would expect on its schedule) LSU ranks No. 38.
- This week: No. 19 Mississippi State at No. 8 LSU. The model has LSU by 8.7 (71%); Vegas has LSU by 16.5, so the betting market is even higher on LSU than the model is.
- The real test: vs No. 1 Alabama in week 10, where the model gives LSU a 33% chance.
- Playoff odds: 34%.
- Quarterback: Sam Leavitt, 1,495 yards, 10 TD, 8 INT, No. 25 of 117 FBS quarterbacks in efficiency.
Playoff picture
The 12 teams most likely to make the field, then the next four. From 10,000 simulations of the rest of the season, conference title games and the bracket.
| Team | Projected | Conf. title | Playoff | National title |
|---|---|---|---|---|
| Notre Dame | 11.2-0.8 | n/a | 99% | 20% |
| Alabama | 10.2-1.8 | 49% | 99% | 25% |
| Georgia | 10.9-1.1 | 39% | 95% | 13% |
| Miami | 10.6-1.4 | 73% | 90% | 11% |
| Ohio State | 9.2-2.8 | 35% | 80% | 8% |
| Indiana | 10.6-1.4 | 30% | 79% | 4% |
| Texas | 8.7-3.3 | 5% | 69% | 4% |
| UCLA | 10.6-1.4 | 22% | 65% | 2% |
| Texas Tech | 10.3-1.7 | 28% | 51% | 2% |
| Utah | 10.1-1.9 | 28% | 51% | 2% |
| Boise State | 9.0-2.0* | 53% | 39% | <1% |
| BYU | 9.5-2.5 | 22% | 39% | 1% |
| First four out | ||||
| James Madison | 10.9-1.1 | 65% | 38% | <1% |
| Missouri | 8.5-3.5 | 3% | 38% | 1% |
| LSU | 7.8-4.2 | 1% | 34% | 2% |
| Houston | 9.2-2.8 | 11% | 30% | 1% |
The Group of 6 bid: the highest-ranked team from the American, Conference USA, the MAC, the Mountain West, the Pac-12 and the Sun Belt gets in, champion or not (new for 2026). Leading that race: Boise State (39% to make the field), James Madison (38% to make the field), New Mexico (10% to make the field).
* Boise State has fewer than 12 games on the schedule in our data source, so the projection covers only those.
Model estimates: the committee's choices are approximated, so treat the odds for teams with tough schedules as rough.
Week 7 picks for the other big games
| Game (model ranks) | Kickoff (ET) | Model | Win % | Vegas |
|---|---|---|---|---|
| No. 19 Mississippi State at No. 8 LSU | Sat noon, ESPN | LSU by 8.7 | 71% | LSU by 16.5 |
| No. 1 Alabama at No. 17 Tennessee The Third Saturday in October | Sat 3:30 p.m., ABC | Alabama by 12.0 | 77% | Alabama by 8 |
| No. 12 Missouri at No. 18 Ole Miss | Sat 3:30 p.m., SEC Network | Missouri by 0.9 | 52% | Ole Miss by 5.5 |
| Auburn at No. 3 Georgia The Deep South's Oldest Rivalry | Sat 3:30 p.m., ESPN | Georgia by 19.8 | 89% | Georgia by 19.5 |
| Florida State at No. 4 Miami The Florida State-Miami rivalry | Sat 7 p.m., ESPN | Miami by 18.8 | 88% | Miami by 20.5 |
| No. 2 Notre Dame at No. 14 BYU | Sat 7:30 p.m., ABC | Notre Dame by 9.0 | 71% | Notre Dame by 10.5 |
| Oklahoma State at No. 15 Houston | Sat 7:30 p.m., Fox | Houston by 10.7 | 75% | Houston by 4.5 |
| No. 13 Nebraska at No. 16 Oregon | Sat 11 p.m., Fox | Oregon by 2.0 | 55% | Oregon by 7 |
Where the model and Vegas disagree
The biggest gaps between the model and the betting line this week, in games with a ranked or Power 4 team. Read them as the model's long shots: from 2022 through 2025, when the gap was 6 points or more, the line ended up closer to the final margin 62% of the time (482 games), and when the two picked different winners, Vegas was right 54% of the time. A big gap usually means the line knows something the model doesn't, like an injury.
- Louisville at Syracuse: model Louisville by 6.6; Vegas has Louisville by 15. A 8.2-point gap.
- Mississippi State at LSU: model LSU by 8.7; Vegas has LSU by 16.5. A 7.6-point gap.
- Pittsburgh at Boston College: model Pittsburgh by 13.5; Vegas has Pittsburgh by 6.5. A 7.0-point gap.
Week 6's best performances
From the box scores: passers ranked by adjusted yards per attempt (touchdowns add 20 yards, interceptions take away 45; 20+ attempts), runners and receivers by yards (15+ carries, 5+ catches).
- Passing: Noah Fifita, Arizona: 16/23 for 341 yards, 3 TD, 1 INT (15.5 adjusted yards per attempt), in a 52-31 win over West Virginia.
- Rushing: Isaac Brown, Louisville: 17 carries for 235 yards (13.8 a carry), in a 44-20 win over Florida State.
- Receiving: Jesse Legree, Oregon State: 10 catches for 191 yards, in a 66-14 win over San Diego State.
Most productive players (a Heisman watch by the numbers)
Who has added the most value this season: points added above what an average player would have produced on the same plays, adjusted for the defenses faced (garbage time excluded). It's not a Heisman prediction; voters weigh stats, team success and big moments, and quarterbacks dominate any list like this.
| Player | Team | Season | Points added above average | Plays |
|---|---|---|---|---|
| Jayden Maiava | USC | 2,045 passing yards, 18 TD, 3 INT | 111.7 | 231 |
| Conner Weigman | Houston | 1,427 passing yards, 15 TD, 1 INT | 107.1 | 209 |
| Tayven Jackson | North Texas | 1,859 passing yards, 15 TD, 4 INT | 98.9 | 206 |
| Maddux Madsen | Boise State | 1,296 passing yards, 13 TD, 0 INT | 92.9 | 193 |
| Darian Mensah | Miami | 1,438 passing yards, 15 TD, 0 INT | 88.7 | 128 |
Risers and fallers
- Up: Oregon State (+24 to No. 34, after beating San Diego State 66-14); Wake Forest (+16 to No. 22, after winning 38-14 at NC State); South Carolina (+16 to No. 33, after winning 38-19 at Florida).
- Down: Florida (−18 to No. 37, after losing 38-19 to South Carolina); Texas A&M (−16 to No. 31, after losing 27-6 at Missouri); Penn State (−9 to No. 38, after losing 31-23 to USC).
How this is made
Each team starts from a preseason rating (last season, returning production and roster talent), and every game moves it toward what actually happened, using the final margin and play-by-play efficiency with opponent strength built in. The preseason rating fades as the season goes: it counts for less from week 7 and not at all from week 10, so by then the rankings come only from this season's games. A confirmed quarterback absence moves a team's rating by half the gap between the starter and his replacement (tested on 2024 and 2025); other injuries are flagged but not priced. Tested on 2022 through 2025 without peeking ahead, from week 4 on it missed final margins by 12.4 points on average; the Vegas closing line missed by 12.0 (in weeks 1-3, when ratings lean on preseason expectations, the gap is wider: 13.7 vs. 12.2). Next week's edition grades these picks, misses included.
This post is generated automatically each week from the model's data. Every number in it is computed from play-by-play and box scores (via CollegeFootballData.com), and player numbers are checked against the official box score before they're used. The sentences come from templates I wrote, and any post can be edited by hand. I built the model and the automation with Claude as a pair programmer; the choices about what to measure and what to say are mine.